Your No-Code Guide to Sales Funnel Analysis
Sales funnel analysis is really just a fancy way of saying you're mapping out how people go from "who are you?" to "here's my money." The whole point is to figure out where things are breaking down, where you're losing people, and—most importantly—to finally answer that age-old marketing question: “Where are our best customers actually coming from?”
Why Sales Funnel Analysis Is Your Secret Weapon
Let's be honest. Sales funnel analysis isn't about getting lost in a spreadsheet vortex. It's about getting real answers. I’ve talked to countless marketers who are pulling their hair out over messy attribution data in their CRM. They know their campaigns are working, but they can't prove which ones are actually driving sales. This guide is built to solve that exact problem, without you ever having to touch a line of code.
Think of your funnel as the complete journey someone takes with your brand. They find you, they get interested, they talk to you, and hopefully, they buy something. If you don't understand each step of that journey, you're just throwing money at the wall and hoping something sticks.
Unlock Your Marketing Potential
When you get this right, your marketing stops being a "cost center" and starts becoming a predictable way to grow the business. It gives you the power to:
- Pinpoint Your Winning Channels: Find out for sure if it’s Google Ads, organic search, or that weird LinkedIn campaign that’s bringing in leads who actually close.
- Plug the Leaks: See exactly where people are dropping off. Are they ghosting you after they submit a form? Or are they getting proposals and then going silent?
- Get Better ROI: You can finally shift your budget to the channels that make you the most money and stop wasting cash on the ones that don't.
- Get Sales and Marketing on the Same Page: With clear data, both teams can finally agree on what a good lead looks like and how the customer journey works. No more guesswork.
Before we dive into the "how-to," let's quickly review the key metrics you'll be calculating. Think of this as your cheat sheet for the rest of the guide.
Key Metrics for Your Sales Funnel Analysis
| Metric | What It Measures | Why It Matters for You |
|---|---|---|
| Leads | The total number of new contacts entering your funnel. | Your starting point. This shows the overall volume of interest you're generating. |
| Conversion Rate | The percentage of people who move from one stage to the next. | This is how you spot leaks. A low conversion rate tells you something is broken. |
| Funnel Drop-Off | The percentage of people who exit the funnel at a specific stage. | Highlights your biggest problem areas so you know where to focus your attention first. |
| Lead-to-Close Rate | The percentage of total leads that become paying customers. | The ultimate measure of your funnel's overall health and efficiency. |
| Revenue by Channel | The total revenue generated from leads that came from a specific source. | The money metric. This proves which channels are actually worth your investment. |
These metrics are what will turn your raw data into actionable insights, helping you make smarter, more profitable decisions.
The numbers don't lie. The average sales funnel conversion rate hovers around a meager 2.9%, and a jaw-dropping 68% of companies admit they don't even have a properly measured funnel. Meanwhile, businesses that do get organized see their average deal size jump by 102%. A deep dive into customer acquisition analytics isn't just a good idea; it’s where you find the data to make all this happen.
Key Takeaway: Sales funnel analysis isn’t just about making charts. It’s about making smarter decisions with your time and money. It gives you the proof you need to stop guessing and start doubling down on what truly grows the business.
We're going to break this whole process down step-by-step. You'll soon have a crystal-clear picture of where your best leads come from, giving you the confidence to make decisions that directly boost the bottom line.
Map Your Funnel and Capture Lead Sources Automatically
Before you can analyze anything, you need a map. A vague sales funnel leads to vague data, so the first thing we need to do is define the key stages a person moves through on their way to becoming a customer. Get this right, and everything else falls into place.
For a typical B2B service business, a practical funnel usually looks something like this:
- Website Visitor: Someone lands on your site from any marketing channel.
- Form Submitted (Lead): They fill out a contact form, book a demo, or download a resource.
- Meeting Booked (MQL): A sales-qualified meeting is scheduled. This is a huge milestone.
- Proposal Sent (SQL): After a good meeting, a formal proposal or quote goes out.
- Deal Won (Customer): They sign on the dotted line and become a paying customer.
This simple structure gives you a clear journey to track. But just knowing how many people move from one stage to the next isn't enough. The real power comes from knowing where your best customers came from.
This diagram shows a simplified customer journey, illustrating how a person moves from initial discovery to becoming a customer.
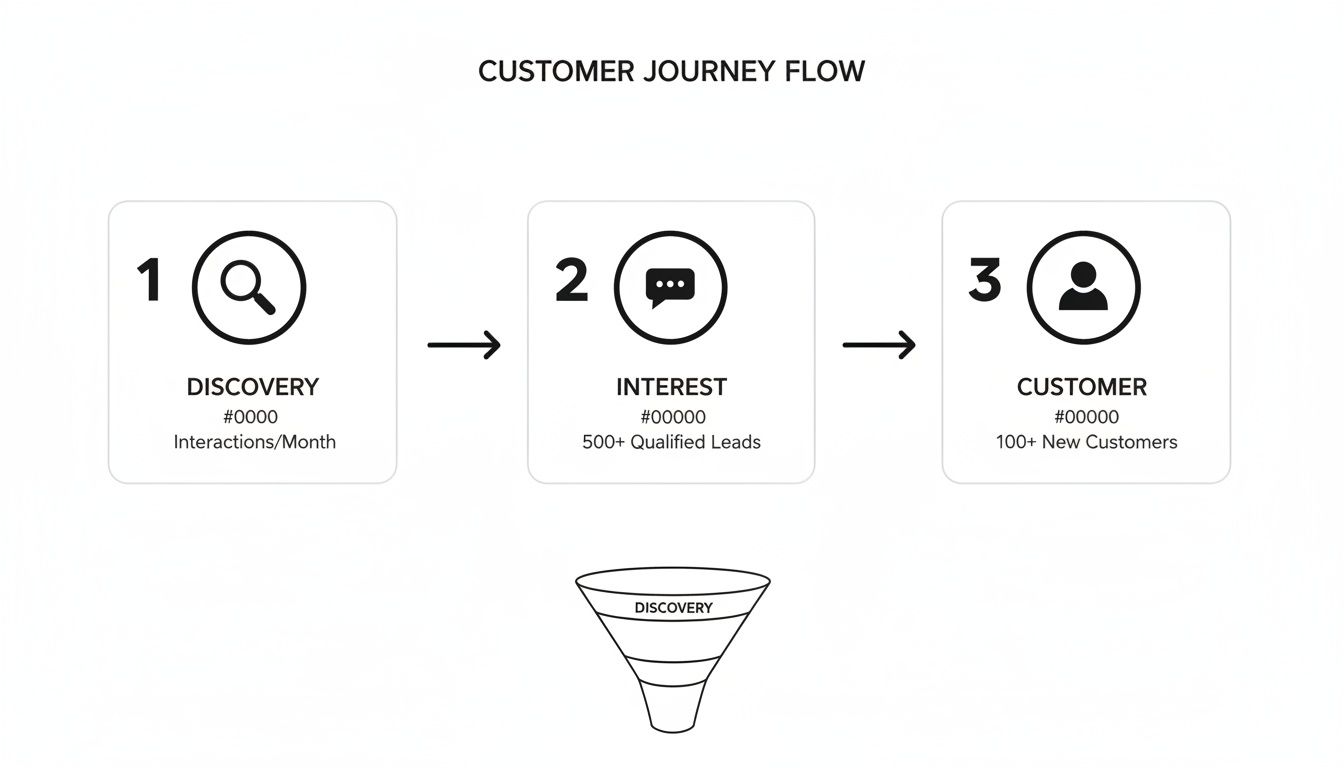
As you can see, each stage is a critical transition point. It's an opportunity to build trust or, frankly, lose a potential customer for good.
The Million-Dollar Question: Where Did They Come From?
This is where most marketing analysis falls apart. Was it that specific Google Ad that drove a lead who just closed for $20,000? Did your latest blog post bring in three high-quality meetings? Without reliable attribution data, you're just flying blind.
Relying on a "How did you hear about us?" field on your forms is a recipe for disaster. People often forget, or they’ll give a generic answer like "Google" when they actually clicked a very specific paid ad you're spending hundreds on.
You need a system that automatically captures the source of every single lead. This has to work silently in the background, without your leads or your team having to do a thing. This is the bedrock of accurate sales funnel analysis.
The goal is to have clean, organized attribution data attached to every contact record in your CRM from the moment it's created. That means every new lead should have fields that specify the exact channel, campaign, and even keyword that brought them to your door.
Automating Attribution Without Touching Code
For non-technical marketers, the thought of setting this up sounds terrifying. It usually brings to mind custom scripts, wrestling with Google Tag Manager, and bugging developers. It really doesn't have to be that way anymore.
Tools like Attributer were built to solve this exact problem. They work by capturing marketing source data—like the UTM parameters from your ads or the specific referring website—the moment a visitor lands on your site.
This information is then stored in the visitor's browser. When they finally fill out one of your website forms, the tool automatically writes all that captured data into hidden fields you've added.
When a lead submits the form, their contact details and all that rich marketing attribution data get sent straight into your CRM. The result? A perfectly attributed lead record. No code, no manual data entry, just reliable information you can actually use.
Setting Up Your System for Success
Getting this kind of automated tracking in place is surprisingly straightforward. Here’s a quick look at how it all comes together:
- Define Your Funnel Stages: First, make sure you have the exact stages you mapped out earlier set up in your CRM.
- Add Hidden Fields to Forms: In your form builder (like Gravity Forms, Typeform, or HubSpot Forms), add a few hidden fields for your marketing data. I usually use Channel, Campaign, and Landing Page.
- Install an Attribution Tool: Add a small snippet of code from a tool like Attributer to your website. This is typically a one-time, copy-and-paste job that takes five minutes.
- Map Fields to Your CRM: Finally, make sure the hidden fields in your form are correctly mapped to the right properties on your contact records in the CRM.
Once this is set up, the whole process runs on autopilot. Every new lead that enters your funnel will have its origin story attached, ready for you to analyze. If you want to go deeper, our complete guide on lead source tracking walks through getting this set up perfectly.
With this foundational data capture in place, you're no longer guessing. You're ready to start calculating the conversion rates that truly matter.
Calculate the Conversion Rates That Truly Matter
Okay, this is where the magic happens. With clean attribution data finally flowing into your CRM for every single lead, you can stop obsessing over vanity metrics like website traffic and start calculating the numbers that actually drive revenue. This is the moment your sales funnel analysis transforms from a pile of raw data into your new favorite decision-making tool.
The goal here isn't to build some monstrously complex spreadsheet. It's about getting clear, simple answers to the most important questions. Are your marketing efforts bringing in people who actually want to talk to your sales team? And are those conversations turning into paying customers?
Let's dig in by focusing on the two most important conversion rates for just about any B2B sales funnel.
Lead to MQL Conversion Rate
First up is the Lead to MQL (Marketing Qualified Lead) Conversion Rate. This metric shows you the percentage of people who fill out a form and then successfully book a meeting with your team. Pay close attention to this one—it’s often the first major leak in the entire funnel.
A low conversion rate at this stage is a huge red flag. It tells you there's a disconnect somewhere. You're getting people interested enough to give you their contact info, but something is stopping them from taking that crucial next step.
The formula itself is pretty straightforward:
(Total Meetings Booked in a Period / Total New Leads in the Same Period) x 100
Let’s run through a quick example. Imagine your agency generated 100 new leads from your website last month. After running them through your follow-up sequence, your sales team managed to book 15 meetings.
The math looks like this: (15 Meetings / 100 Leads) x 100 = 15%
A 15% Lead to MQL rate is your new baseline. Now you can start asking the right questions. Was your team too slow on the follow-up? Did the "thank you" page just dead-end the conversation? Or were the leads just not a good fit to begin with? This single number points you right to the problem area.
SQL to Won Conversion Rate
The next critical number is your SQL to Won Conversion Rate. This tells you the percentage of qualified opportunities that become paying customers. For our funnel, we’ll define a Sales Qualified Lead (SQL) as any lead who has received a proposal from your team.
This metric is all about measuring your sales team's effectiveness at closing. If this number is weak, it could signal problems with your pricing, the clarity of your proposals, or even something in the sales process itself.
Here’s the formula we’ll use:
(Total Deals Won in a Period / Total Proposals Sent in the Same Period) x 100
Let’s stick with our example. Out of those 15 meetings that were booked, 10 of them were promising enough to move to the proposal stage (these are now your SQLs). Of those 10 proposals sent out, the team closed 3 as new clients.
So, the calculation is: (3 Deals Won / 10 Proposals Sent) x 100 = 30%
A 30% SQL to Won rate is a pretty solid number. It suggests that once your team gets a qualified prospect to the proposal stage, they have a strong chance of closing the deal.
Your Turn to Analyze: Just by calculating these two metrics, you can get a surprisingly accurate diagnosis of your funnel's health. Is your problem at the top (getting meetings booked) or at the bottom (closing deals)? Knowing this stops you from wasting time and resources trying to fix the wrong part of the process.
How Do Your Numbers Stack Up?
Knowing your own numbers is the first step, but context is everything. How do your conversion rates compare to others in the industry? This helps you set realistic goals. For example, typical MQL to SQL conversion rates tend to fall between 16-20%, while opportunity-to-close rates often land anywhere from 10-28%. These benchmarks are more important than ever, especially now that sales cycles have gotten 32% longer and the average deal involves 10 different stakeholders. You can find more details on these sales funnel conversion rates.
When you compare your 15% Lead to MQL rate against these benchmarks, you can see you’re in the ballpark but definitely have room to improve. On the other hand, your 30% close rate is at the high end, which points to a strong sales process.
This simple analysis tells a clear story: your biggest opportunity for growth isn't in tweaking your sales pitch. It’s in optimizing that initial lead follow-up to get more of those hard-won leads onto a sales call. Without doing the math, you’d just be guessing. Now, you have a data-backed starting point for making changes that will actually move the needle.
Visualize Your Funnel to Find Hidden Leaks
Spreadsheets are great for number crunching, but let's be honest—they don't exactly scream for attention. Nothing makes a problem clearer than seeing it laid out visually. A funnel chart takes your conversion rates from abstract numbers on a screen and turns them into a story.
It’s the kind of thing that makes insights impossible for your team to ignore, and it’s a non-negotiable part of any real sales funnel analysis.

Whether you use a built-in dashboard in your CRM or export the data to a tool like Google Sheets, the goal is always the same. You need a simple chart that shows the total volume of leads at each stage and, most importantly, the exact percentage that drops off between each step.
This isn’t about making fancy graphs for a slide deck. It's about making your "funnel leaks" so painfully obvious that everyone involved can see them instantly. That visual clarity is what sparks the right conversations and pushes people to actually do something about it.
Building Your Funnel Visualization
You don’t need to be a data wizard to create one of these charts. Most modern CRMs have a dashboard widget that can build a funnel for you in a few clicks. If yours doesn't, or if you want more control, exporting your data to Google Sheets is a fantastic alternative.
Let’s stick with our B2B agency example. Here’s the data we’d be working with:
- Total Leads: 100
- Meetings Booked (MQLs): 15
- Proposals Sent (SQLs): 10
- Deals Won: 3
When you plot this out, you can immediately see the chokepoints. The visualization doesn’t just show static numbers; it shows a loss of momentum and forces you to confront where your process is breaking down.
A visual funnel instantly highlights your biggest points of failure. Seeing a 100-lead top of the funnel shrink to just 15 MQLs is a glaring problem that a single column in a spreadsheet just can't convey with the same urgency.
Suddenly, that ambiguous data becomes a clear narrative. For instance, a massive drop between the 'Lead' and 'MQL' stage might have nothing to do with lead quality. It could easily be a sales follow-up issue, like painfully slow response times or even a broken link in a scheduling email.
Interpreting the Visuals for Action
Once you have your chart, the real work begins. Think of your visualization as a diagnostic tool that points you directly to the symptoms of a much bigger problem.
Looking at our example chart, the most dramatic drop-off is between the "Lead" and "MQL" stages—a staggering 85% of potential deals just vanish. That's a massive leak, and the chart makes it the undeniable priority.
Your next move is to dig into the why behind this drop.
- Review Follow-Up Speed: Seriously, how long does it take for a rep to contact a new lead? A delay of even a few hours can absolutely crater your conversion rates.
- Analyze Follow-Up Content: Are the initial emails or calls actually compelling? Do they give a prospect a good reason to book a meeting?
- Check the User Experience: Is booking a meeting a pain? A clunky calendar tool or a form with too many fields can be a silent killer of conversions.
In contrast, the drop from "SQL" to "Won" is much smaller. A 30% close rate on proposals is pretty solid. The chart tells you to stop wasting time rewriting proposals and instead pour all your energy into fixing that critical first touchpoint.
Fixing these leaks is everything. Once you've spotted them, implementing smart marketing automation strategies to fix your sales funnel can plug the holes and stop revenue from bleeding out. For a deeper look at creating reports like this, check out our guide on building a powerful marketing attribution dashboard. This visual-first approach ensures you’re always focusing on the changes that will actually move the needle.
Connect Marketing Channels Directly to Revenue
This is where all your hard work pays off. After mapping your funnel and getting the data flowing, you can finally answer the biggest questions in marketing: "Which channels are actually making us money?" and, "Where should we invest our next dollar?"
When you have clean, automated attribution data right inside your CRM, you’re not just talking about leads anymore. You're talking about revenue. This single change completely flips the conversation about marketing's value, turning your team from a perceived cost center into a celebrated revenue engine.

It’s about making a direct line from every dollar you spend to a real, tangible outcome. That’s how you start making truly confident, data-backed decisions.
Build Your Channel Performance Report
Your ultimate goal here is to create a report that breaks down funnel performance channel by channel. This lets you see, side-by-side, how things like Google Ads, Organic Search, and LinkedIn compare—not just on the number of leads they generate, but on the actual customers and revenue they bring in.
Most CRMs have reporting features that let you build this out. You’ll want to group your contacts or deals by that "Channel" property you set up earlier, which should now be automatically populated by your attribution tool.
Here are the key metrics to pull in for each channel:
- Total Leads: The raw count of new contacts you generated.
- Customers Won: How many of those leads actually became paying customers.
- Lead-to-Customer Rate: The overall top-to-bottom conversion rate for that specific channel.
- Total Revenue: The sum of all the deal values from customers who came from that channel.
This report is how you find your winners and losers. It’s the definitive proof of what’s working.
Answering the Big Questions with Data
Let's walk through a real-world scenario. Imagine our B2B agency pulls its channel performance report for the last quarter. Suddenly, a clear picture emerges, answering questions that used to be pure guesswork.
Here's a look at how to structure that data in a simple table.
Sample Channel Performance Report
| Marketing Channel | Total Leads | Customers Won | Lead-to-Customer Rate | Total Revenue |
|---|---|---|---|---|
| Google Ads | 55 | 6 | 10.9% | $72,000 |
| Organic Search | 30 | 4 | 13.3% | $60,000 |
| Direct | 10 | 1 | 10.0% | $12,000 |
| 5 | 0 | 0% | $0 |
This simple report tells a surprisingly powerful story. While Google Ads drove the most leads and the most revenue, Organic Search is actually the most efficient channel, converting leads into customers at a higher rate (13.3%).
Key Insight: This analysis proves that a channel's value isn't just about lead volume. A channel that generates fewer but higher-quality leads can be significantly more valuable to your business.
Based on this, the marketing team has clear, actionable next steps. They can confidently increase the budget for Google Ads, knowing it delivers a strong return. More importantly, they now have a rock-solid case for investing more resources into their SEO strategy, since it’s their most efficient channel for acquiring new customers.
Understanding Channel-Specific Conversion Rates
It’s perfectly normal to see different conversion rates across your channels. Understanding these nuances is crucial. For example, industry research often shows that paid search averages a 3.2% conversion rate, while organic search is around 2.7% and direct traffic hits about 3.3%. Knowing these benchmarks helps you set realistic expectations and spot where you're outperforming the average.
This level of detailed reporting also opens the door to more advanced strategies. If you're ready to dig deeper into how different touchpoints contribute to a single sale, our guide on multi-channel attribution modeling is a great next read.
The real power of sales funnel analysis is this kind of clarity. It empowers you to stop wasting money on channels that aren't delivering—like LinkedIn in this example, which brought in zero customers. You can confidently reallocate that budget to your proven performers, creating a smarter, more efficient marketing machine that consistently drives real business growth.
Got Questions About Sales Funnel Analysis? You're Not Alone.
Jumping into your sales funnel data can feel a bit overwhelming, and it's totally normal for a few questions to pop up. Let's walk through some of the most common hurdles I see marketers face. Getting these sorted will help you turn all that data into actual, measurable wins.
What If I See a Huge Drop-Off at the Top of My Funnel?
This is probably the most frequent issue I hear about. You've got tons of website visitors, but very few are turning into actual leads. It's a classic leak, and it almost always points to a disconnect between who you're attracting and what you're offering.
Before you start overhauling your entire strategy, zoom in on these three things:
- Your Landing Pages: Take a fresh, honest look. Is your call-to-action (CTA) impossible to miss? Is your form a monster, asking for a blood sample and their mother's maiden name on the first date? Your copy needs to hit them with value right away and speak directly to the problem they're trying to solve.
- Website Performance: How fast does your site load, especially on a phone? Seriously, test it. A slow site is the ultimate conversion killer. People will hit the back button before your brilliant CTA even has a chance to load.
- Traffic Quality: Where are your visitors coming from? If you’re running paid ads, dig into your targeting. You can have the best landing page in the world, but if you're driving the wrong traffic to it, your conversion rates will always be disappointing.
How Can I Do This if My Data Is Split Between Different Tools?
Ah, the "data everywhere" problem. Your website traffic is in Google Analytics, your forms are in Typeform, and your deals live in a CRM like Pipedrive. It's a common mess. The key is to make your CRM the single source of truth.
This is where a dedicated attribution tool becomes your best friend. It quietly works in the background, grabbing all that juicy marketing source data from a visitor's session and automatically pushing it into your form's hidden fields.
When someone fills out your form, their contact info and their entire marketing journey—where they came from, the campaign that got them there—are bundled together and sent straight to your CRM. This creates one clean, unified record right from the start.
By doing this, you solve the multi-tool headache before it even begins. You can build every funnel report you need directly inside your CRM or export one complete dataset. No more late nights trying to stitch together spreadsheets.
How Often Should I Analyze My Sales Funnel?
The answer really depends on your business rhythm—specifically, your lead volume and how long it takes to close a deal.
For businesses with a steady stream of leads and a short sales cycle (think days or weeks), a monthly analysis is perfect. It’s frequent enough to let you spot trends and tweak your campaigns without getting bogged down.
But if you have a longer sales cycle that stretches over several months, a quarterly analysis is probably a better fit. You need to give leads enough time to actually move through the entire funnel to get an accurate picture. The most important thing is to be consistent. Pick a schedule and stick to it.
My CRM Lacks Good Reporting Features. What Can I Do?
Don't let a clunky CRM stop you. If its built-in reporting is weak, your best bet is to pull the data out and work your magic in a more flexible tool like Google Sheets or Microsoft Excel.
Most CRMs have a simple export function that will give you a CSV file of your contacts and deals. The trick is to make sure your export includes fields like the lead creation date, deal stages, deal value, and—most critically—the custom marketing attribution fields you set up (like Channel, Campaign, etc.).
Once that data is in a spreadsheet, you're in the driver's seat. You can use pivot tables and build charts to calculate your conversion rates, visualize the funnel, and see exactly where your revenue is coming from. It might feel like an extra step, but it gives you total control over your analysis.
Ready to stop guessing where your best customers come from? LeadPulse automatically captures marketing attribution data and sends it into your CRM, giving you the clarity you need to make smarter marketing decisions. See exactly which channels are driving revenue and optimize your funnel with confidence. Learn more about how LeadPulse can help your business.
The Ultimate Return On Ad Spend Calculator and Guide
Use our simple Return On Ad Spend Calculator to instantly measure campaign profits. Learn what ROAS is, how to calculate it, and how to fix bad attribution.
Customer Journey Mapping Tools: 12 Best Options for Marketers
Explore the top customer journey mapping tools for marketers. Compare features, pricing, and integrations to map your customer experience quickly.