The Ultimate Return On Ad Spend Calculator and Guide
Think of Return on Ad Spend (ROAS) as a simple report card for your advertising. It gives you one powerful number that tells you exactly how much money you’re making for every single dollar you put into your ad campaigns.
This metric cuts right to the chase, answering the most critical question: Are my ads actually profitable?
What Return On Ad Spend Actually Means

Let's use an analogy. Imagine your advertising budget is a vending machine. For every dollar you put in, you want to know how many snacks (your revenue) you get out. ROAS tells you precisely that. If you put $1 in and get $4 worth of snacks back, your ROAS is 4:1.
It’s this simple concept that makes ROAS so essential for any marketer or business owner. It pushes past vanity metrics like clicks and impressions to focus squarely on what matters most: financial results.
Before we dig into the ad-specifics, it's worth knowing that ROAS is a more focused version of the broader business concept, Return on Investment (ROI). While ROI measures the overall profitability of an entire investment, ROAS zooms in specifically on the performance of your ad campaigns.
Why You Can't Afford to Ignore ROAS
Keeping a close eye on your ROAS isn’t just a good habit—it's absolutely critical for growing your business. Without it, you’re flying blind. You're just spending money, hoping for the best, with no real idea which channels are making you money and which are just draining your bank account.
Getting a clear picture of your ROAS lets you:
- Make Smarter Budget Decisions: You can confidently pump more money into campaigns that are crushing it and pull back on the ones that aren't pulling their weight.
- Justify Marketing Spend: ROAS gives you the hard data to prove that your advertising is directly contributing to the bottom line. This makes it much easier to get budget approval and show your value.
- Pinpoint Winning Strategies: By comparing the ROAS of different ads, platforms, or audiences, you can quickly see what works and do more of it.
In short, ROAS transforms advertising from a guessing game into a calculated strategy. It’s the difference between hoping for results and engineering them.
Moving Beyond a Simple Formula
While the basic calculation—Revenue ÷ Ad Spend—is straightforward, truly understanding ROAS is about more than just plugging in numbers. It’s about understanding the story those numbers are telling you.
For example, a 2:1 ROAS might be a disaster for a business with slim profit margins. But for a company with high customer lifetime value, it could be a perfectly healthy starting point.
This guide, complete with our interactive return on ad spend calculator, will show you how to not only calculate your ROAS but also how to interpret it correctly. You'll learn how to set realistic goals, troubleshoot campaigns that aren't performing, and ultimately, turn your ad budget into a predictable engine for growth.
Your Interactive Return On Ad Spend Calculator
This is the simple tool you came for. Forget about messing with spreadsheets or remembering formulas—our interactive return on ad spend calculator gives you a fast, clear look at how your campaigns are performing.
Just plug in your total revenue and ad spend below to get your ROAS. We'll show you the result as both a simple ratio, like 4:1, and a percentage, like 400%, so you get the full picture.
Finding Your Numbers
To get a reliable result, you just need two key figures. Here’s a quick guide on where to find them:
Total Revenue from Ads: This is the direct income your campaigns brought in. You can usually find this in your ad platform's dashboard (think Google Ads or Meta Ads). For the most accurate number, check your CRM and filter for closed deals that came from a specific ad campaign.
Total Ad Cost: This one's easy. It's the total amount of money you spent on your ads. You'll find this number clearly listed in the billing or summary section of your ad platform account.
Once you have those two numbers, the calculator handles the rest.
Go ahead and bookmark this page. It's the simplest way to run a quick health check on any campaign and make sure your ad budget is pulling its weight.
Beyond ROAS: A Broader View
Calculating ROAS is a fantastic first step. It tells you exactly how much revenue your ads are generating.
But it's only one piece of the puzzle. ROAS shows you the return, but it doesn't tell you what it costs to land each new customer through those ads.
For a deeper dive into your marketing efficiency, you should also check out our Customer Acquisition Cost (CAC) calculator. Looking at ROAS and CAC together gives you a much more complete view of your marketing health, helping you make smarter decisions that drive real growth.
How To Calculate ROAS With Real-World Examples
Even though our interactive calculator handles the math for you, getting a feel for the simple formula behind it is the best way to really take control of your marketing strategy. The good news is, the formula itself is incredibly simple.
ROAS Formula: Total Revenue Generated from Ads / Total Ad Spend
This little equation tells you exactly how many dollars you get back for every single dollar you spend on ads. So, if your ROAS is 4, it means you earned $4 for every $1 you put in—a 4:1 return.
But enough theory. Let's walk through a couple of real-world scenarios to see how this plays out.
Example 1: The B2B SaaS Company
Let’s start with a fictional SaaS company, "InnovateTech," that sells project management software. Their main goal is to get qualified demo requests from their Google Ads campaigns, since they know that each closed deal brings in a lot of money over time.
They decide to run a targeted search campaign for one month. Here's a look at their numbers.
1. Calculate the Total Ad Spend First, InnovateTech has to add up all the costs tied to their Google Ads campaign. This is about more than just what they paid for clicks.
- Google Ads Campaign Cost: $4,000
- Ad Creative (freelance designer): $500
- Landing Page Software Subscription (monthly): $100
Their Total Ad Spend comes out to $4,600. It's so important to track these extra costs if you want a true picture of your return.
2. Track the Revenue Generated Over that month, the campaign brought in 50 demo requests. The sales team got to work, and within the next 60 days, they closed 5 new deals.
Each new customer signed up for the company's mid-tier plan, which costs $2,000 per year.
- Deals Closed: 5
- Revenue Per Deal: $2,000
- Total Revenue: 5 x $2,000 = $10,000
3. Put It All Together Now we just plug those numbers into the formula:
- ROAS = $10,000 (Revenue) / $4,600 (Ad Spend)
- ROAS = 2.17
InnovateTech’s ROAS is 2.17:1. For every dollar they spent, they brought in $2.17 in new annual revenue. This might not sound like a home run, but for a SaaS business where customers stick around for years, it's actually a very strong start.
Example 2: The Consulting Business
Let's switch gears and look at a business coach who uses Facebook ads to fill a high-ticket coaching program. Here, the sales cycle is much shorter, so they need a fast, clear way to see if their campaigns are working.
Think about it this way: you run a small coaching business, and you spend $5,000 on Facebook ads. Those ads push leads from your WordPress site into your HubSpot account. From those leads, you generate $25,000 in new business. That’s a rock-solid 5:1 ROAS, where every dollar you spent brought back five.
Let's run through a similar scenario for another consultant.
1. Calculate the Total Ad Spend This consultant runs a campaign promoting a free webinar, hoping to attract potential clients.
- Facebook Ad Spend: $2,500
- Video Ad Production: $300
- Total Ad Spend: $2,800
2. Track the Revenue Generated The campaign was a success, driving 100 sign-ups for the webinar. After the event, the consultant converted 4 attendees into clients for their premium coaching package.
- Clients Enrolled: 4
- Coaching Package Price: $3,000
- Total Revenue: 4 x $3,000 = $12,000
3. Put It All Together Plugging it into the same formula:
- ROAS = $12,000 (Revenue) / $2,800 (Ad Spend)
- ROAS = 4.28
The consultant's ROAS is 4.28:1. Every dollar they put into their Facebook campaign brought back $4.28 in revenue. That's a clear win.
As you can see, the ROAS formula is flexible enough to work for businesses with long sales cycles or those with quick conversions. If you want to dive even deeper, check out this a comprehensive guide on how to calculate ROAS. The most important thing is to be meticulous about tracking both your total ad costs and the actual revenue that comes directly from those campaigns.
What Is a Good ROAS Benchmark?
So, you’ve run the numbers through a ROAS calculator and have your figure. Now for the real question: is it any good?
The honest answer is… it depends. There’s no single magic number that works for everyone. A “good” ROAS is completely tied to your business—your profit margins, your industry, and what you’re trying to achieve with a specific ad campaign.
Think of it this way: asking for a good ROAS is like asking, "What's a good speed for a car?" Well, are you on a racetrack or in a school zone? A high-margin software company and a low-margin t-shirt shop will have wildly different ideas of what makes a successful ad campaign.
Still, everyone wants a number to aim for. The most common rule of thumb you’ll hear is a 4:1 ROAS. This means for every $1 you spend on ads, you bring in $4 in revenue. For most businesses, that 4:1 ratio is a healthy sign, leaving enough room to cover your ad spend, cost of goods, and other expenses while still turning a decent profit.
Why 4:1 Is a Starting Point, Not a Finish Line
While that 4:1 ratio is a great goalpost, it’s crucial to see it as a guide, not a rule. The real driver of your target ROAS is your business’s financial health.
A company with cushy 80% profit margins could be perfectly happy with a 2:1 ROAS. They have so much room in their pricing that even a modest return from ads is a win.
On the flip side, a business with slim 20% profit margins might need to hit a 10:1 ROAS just to stay in the black after paying for the product, shipping, and all the other overhead that comes with running a company.
For instance, marketing agencies often use that classic 4:1 benchmark for their clients. If they spend $10,000 and bring in $40,000 in sales, that’s usually a solid win. Industry data often backs this up, showing a 4:1 return is strong, though top-tier campaigns can sometimes push past 6:1, especially during busy seasons. You can explore more of these ROAS benchmarks and trends to see how different industries stack up.
How Your Campaign Goals Change the Game
Not all ad campaigns are created equal. Your ROAS target needs to bend with the goal of the ad. It’s just not realistic to expect the same results from an ad targeting a total stranger as you would from an ad shown to a loyal, repeat customer.
Here’s a quick breakdown of how to think about ROAS for different types of campaigns:
Brand Awareness Campaigns: You're introducing your brand to a "cold" audience for the first time. The goal here is getting your name out there, not making immediate sales. A 1:1 or even a slightly negative ROAS can be perfectly acceptable because you're investing in filling the top of your funnel for future growth.
Lead Generation Campaigns: When you’re trying to get someone to sign up for a demo or download an ebook, the immediate ROAS will naturally be low. The real payoff comes later in the sales cycle. For these, Customer Lifetime Value (LTV) is often a much more important metric to track alongside ROAS.
Retargeting Campaigns: This is where the magic happens. You’re targeting a "warm" audience of people who have already visited your website or engaged with your content. They know who you are and what you offer, so conversion rates are way higher. It's not uncommon to see ROAS hit 10:1 or even 20:1 with a sharp retargeting strategy.
General ROAS Benchmarks By Ad Platform
Finally, the platform you’re advertising on matters. User intent and ad costs vary from channel to channel, which means performance will, too. Someone actively searching for your product on Google is in a very different mindset than someone scrolling through TikTok videos.
This table gives you a rough idea of what to expect from some of the major ad platforms.
| Ad Platform | Average ROAS (Ratio) | Context / Best For |
|---|---|---|
| Google Search Ads | 3:1 - 5:1 | High-intent users actively searching for a solution. Often produces a strong, direct return. |
| Google Display Ads | 2:1 - 3:1 | Primarily for brand awareness and reaching users across the web. Lower intent means lower ROAS. |
| Meta Ads (Facebook/Instagram) | 2:1 - 4:1 | Excellent for targeting specific demographics and behaviors, but intent is generally lower than search. |
| TikTok Ads | 1:1 - 3:1 | Great for top-of-funnel awareness and reaching younger audiences. ROAS can be lower but builds brand equity. |
At the end of the day, a "good" ROAS is simply one that helps your business grow profitably. Use the 4:1 ratio as your starting compass, but always adjust your map based on your own profit margins and campaign goals.
The Hidden Data Problem Skewing Your ROAS
If your ROAS numbers feel disappointingly low, the problem might not be your ads. It could be your data.
It’s a classic scenario: marketers see a weak ROAS, pause what look like underperforming campaigns, and shift budgets based on a flawed picture of reality. The culprit is often a simple but critical issue—missing attribution data.
Imagine you hire five salespeople. At the end of the month, a pile of signed contracts lands on your desk, but none of them have a salesperson’s name attached. Who gets the credit? Who gets the commission? That’s exactly what happens when your marketing attribution breaks down.
This data gap is incredibly common. A potential customer clicks your Google Ad, lands on your site, and fills out a contact form. But somewhere along the way, the crucial tracking information—like UTM parameters—gets lost. In your CRM, that valuable, ad-driven lead now looks like they came from nowhere, often getting mislabeled as "Direct" traffic.
The Misleading Trail of Lost Data
When this happens, your ad campaigns appear far less profitable than they actually are. The revenue from that ad-driven customer never gets credited back to the ad campaign that brought them in. Instead, it gets incorrectly assigned to another channel or, worse, no channel at all.
This creates a dangerous feedback loop. You look at your reports, see a low return from your paid ads, and decide to cut the budget. Meanwhile, your "Direct" traffic numbers look amazing, but you have no idea how to get more of it because you don't know where it's really coming from. You end up starving your most effective channels while making decisions in the dark.
The core issue is that you can't optimize what you can't accurately measure. When attribution fails, you’re essentially guessing which marketing efforts are driving real growth, which is a risky way to run a business.
This process flow shows how different campaign goals—from initial awareness to direct goal conversions—require their own unique ROAS benchmarks.
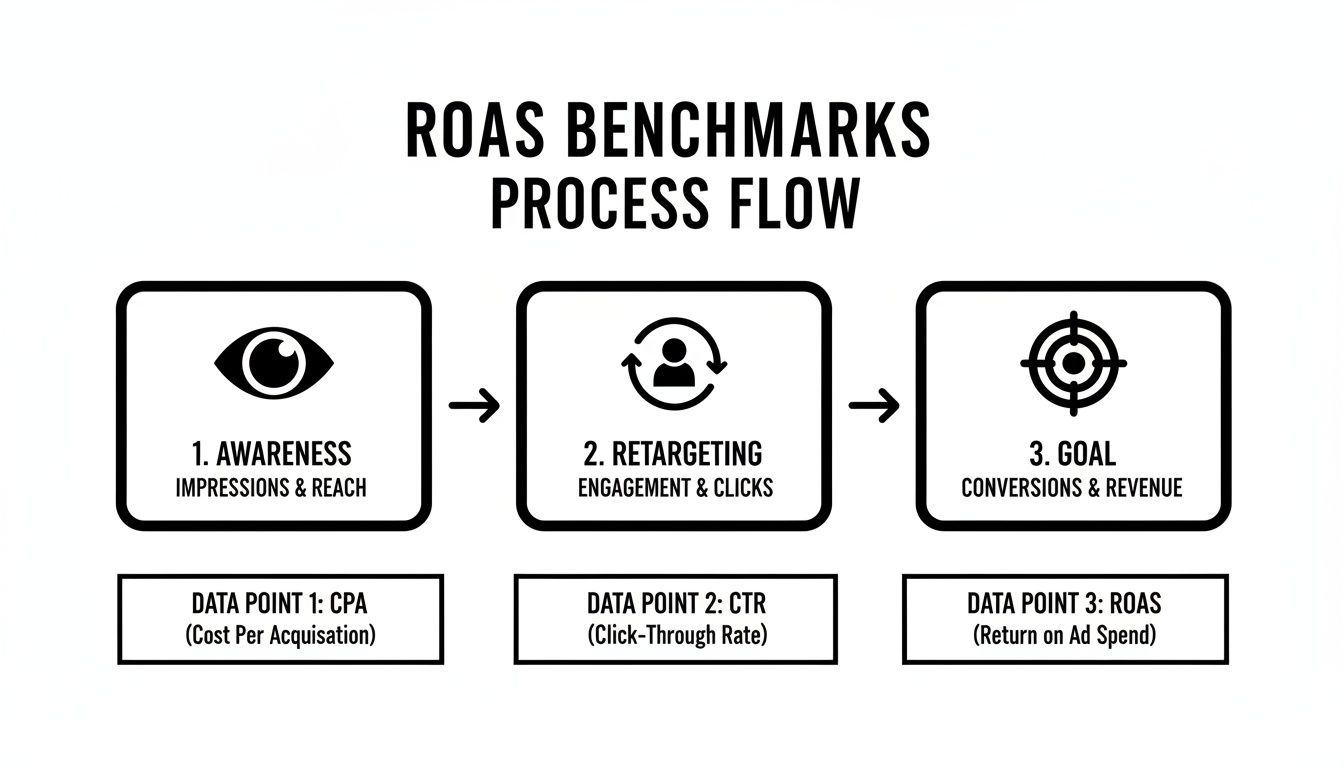
As the visual highlights, it's natural for top-of-funnel awareness campaigns to have lower ROAS expectations compared to high-intent, bottom-of-funnel retargeting efforts.
How Big Is the Attribution Gap?
This isn't just a minor rounding error. The problem is widespread. Without a proper attribution tool in place, you could be missing the source for a huge portion of your leads.
It’s common to see 30-50% of form submissions completely missing their UTM data. This gap can drastically throw off your ROAS calculations, making you believe certain channels are duds when they might actually be responsible for as much as 25% of your customers.
This missing data has real consequences:
- Undervalued Marketing Efforts: Your team could be running brilliant campaigns that are driving significant revenue, but the proof is lost in the data gap.
- Poor Budget Allocation: You risk cutting funds to your top-performing channels and over-investing in ones that only appear to be working.
- Inaccurate Forecasting: If you can't trust your historical data, you can't accurately project future growth or set realistic performance targets.
Why Standard Tracking Falls Short
Many businesses rely on standard analytics setups, assuming they capture everything. But the journey from a click to a conversion is complex, with many opportunities for data to get lost. Tracking scripts can fail to load, users might switch devices, or form submissions might not pass the data correctly to your CRM.
Perfecting this data capture is key, and it often starts with the building blocks of tracking. To ensure your campaigns are set up for success from the start, check out our guide on UTM parameter best practices.
The bottom line is that a faulty data foundation will always lead to a skewed ROAS. Before you blame your ads for poor performance, take a hard look at your attribution. Fixing this hidden data problem is the first and most important step toward calculating a true ROAS and making genuinely data-driven decisions that grow your business.
Getting Accurate Data for a True ROAS
Let's be honest. Skewed ROAS figures are more than just a reporting headache—they lead to terrible business decisions. When you can't trust your numbers, you end up second-guessing your budget, struggling to prove marketing's value, and missing opportunities to scale what's actually working.
The answer isn’t to give up on advertising. It's to fix the broken data pipeline that feeds your return on ad spend calculator.
This is where automated attribution tools come into play. Instead of spending hours manually trying to connect the dots or relying on flaky tracking scripts, these solutions work behind the scenes to make sure no lead falls through the cracks. Think of them as the perfect record-keeper for all your marketing efforts.
Imagine every person who clicks an ad is handed a digital passport. This passport logs every detail of their journey: the exact ad they saw, the campaign it belonged to, the keyword that brought them in, and the channel they came from. The moment they fill out a form, that passport gets stamped and attached to their lead record in your CRM, automatically.
How Automated Attribution Works
Tools like LeadPulse are built to be that digital passport system for your business. It works on its own to capture and connect all the critical marketing data with every single form submission on your website.
Here’s a quick rundown of what happens. When someone lands on your site from an ad or another marketing channel, LeadPulse grabs all the important attribution details, like:
- Channel: Was it Paid Search, Organic Social, or a Referral?
- Source: Which platform did they come from? Google, Facebook, a partner website?
- Campaign: The exact campaign name from your ad platform.
- Content: The specific ad creative or link they clicked.
- Keyword: The search term they used to find you.
This information gets stored right in the user's browser. When they finally convert by submitting a form, LeadPulse instantly passes all that stored data into hidden fields within the form itself.
What’s the result? When that new lead pops up in your CRM, it comes with a complete marketing history. Your sales team knows exactly where they came from, and your marketing reports are suddenly filled with data you can actually rely on.
The Impact of 100% Attribution Accuracy
Fixing your attribution isn't a minor tweak; it fundamentally changes the way you see your marketing performance. When you can connect ad spend to real revenue with pinpoint accuracy, you can finally generate reports that you and your leadership team can stand behind.
This kind of clarity empowers you to:
- Prove Marketing's Value: You can draw a straight line from a specific campaign’s budget to a closed deal, showing exactly how marketing drives the bottom line.
- Optimize with Confidence: Clean data lets you make sharp, informed decisions about which campaigns to scale and which to cut, maximizing your overall ROAS.
- Calculate True ROAS: The numbers you plug into a return on ad spend calculator will finally reflect reality, not a skewed version distorted by data gaps.
Without a dedicated tool, these attribution gaps can be massive. We've seen it time and time again—it’s not uncommon for 35% of leads to have no source data at all. This can make your paid ads look better than they are while completely hiding the 22% contribution from referral traffic.
From Guesswork to Precision
Ultimately, achieving a true ROAS boils down to data integrity. When your CRM knows exactly which ad, campaign, and channel brought in each new customer, your entire marketing process becomes more transparent and a whole lot more effective.
You move from a world of assumptions into one of data-driven certainty. For anyone managing multiple campaigns, understanding the nuances of different attribution models is even more critical. To dive deeper, you can explore our guide on multi-channel attribution modeling to see how different frameworks can unlock even richer insights.
By implementing an automated solution, you ensure every dollar of ad spend is accounted for, every conversion is correctly attributed, and every marketing decision is built on a solid foundation of accurate data. That's the key to unlocking sustainable growth and achieving a ROAS that truly matters.
A Few Common Questions About ROAS
Even with the formula down and a calculator ready, a few questions always seem to pop up. Let's tackle some of the most common ones to make sure you can use ROAS with total confidence.
Think of this as tying up the loose ends. Once we clear up these common points of confusion, you’ll be set to make smarter, more profitable decisions for your campaigns.
What's the Difference Between ROAS and ROI?
This is easily the most frequent question, and the distinction is crucial. In short, ROAS is a very specific, tactical metric, while ROI (Return on Investment) is all about the big, strategic picture.
- ROAS zooms in only on your ad spend. It answers one simple question: "For every dollar I put into this specific ad campaign, how much revenue did I get back?"
- ROI pulls the lens back to look at overall profitability. It factors in all the costs of doing business—salaries, software, rent, cost of goods—to figure out if the entire venture is making money.
Here’s why it matters: you can have a fantastic ROAS and still have a negative ROI if your other costs are too high. A 5:1 ROAS might look great on paper, but if your product margins are only 10%, you’re actually losing money on every single sale.
How Often Should I Calculate My ROAS?
There’s no single magic number here. The right frequency really depends on how quickly your customers buy and how much you're spending on ads.
Here are a couple of solid rules of thumb:
- For fast-paced businesses (like e-commerce): You should be checking ROAS daily or weekly. The sales cycle is short, so you can make quick adjustments that have an immediate impact on your bottom line.
- For businesses with a longer sales process (like B2B SaaS): Looking at ROAS monthly or quarterly makes more sense. This gives your leads enough time to work their way through the pipeline and actually become paying customers.
The key takeaway is that ROAS is a living metric, not a set-it-and-forget-it number. Regular check-ins help you spot trends, fix problems before they get out of hand, and pour more fuel on what's already working. It's all about getting into a rhythm of review and optimization.
Can Other Factors Influence ROAS?
Oh, absolutely. Your ROAS is never just about ad spend. It’s the result of your entire marketing and sales ecosystem working together. Things like seasonality, how well your website converts visitors, your pricing, and even your customer service can all move the needle.
For marketers who aren't deep in the technical weeds, free online tools can offer valuable context by including industry benchmarks. For example, knowing a 3:1 ROAS is considered good for a SaaS company, while 5:1 is killer for e-commerce, helps you understand your own performance.
These tools often point out that the average B2B conversion rate is around 2.6% and that simply improving your ad creative can bump ROAS by 15-20%. You can learn more about how these calculators provide optimization tips to see what's possible.
At the end of the day, a strong ROAS comes from a well-oiled machine, not just one lucky ad.
Ready to stop guessing where your best leads come from? LeadPulse automatically captures and sends complete marketing attribution data with every form fill. That means you can finally calculate a true, accurate ROAS. Discover how LeadPulse can clean up your data and clarify your marketing performance.
Unlocking Lead Source Meaning A Marketer's Guide to Growth
Finally understand the true lead source meaning. This guide explains how to track where customers come from to optimize your marketing and boost ROI.
Your No-Code Guide to Sales Funnel Analysis
Unlock revenue with our practical guide to sales funnel analysis. Learn to track leads, measure conversions, and attribute revenue without any code.