Discover the customer journey report: map ROI across channels
A customer journey report is a marketing tool that tells the origin story of every single lead you get. It connects the dots from a visitor's very first interaction—like clicking one of your Google Ads or finding you through a search—all the way to the moment they fill out a form, become a customer, and start adding to your bottom line.
Why You Need a Customer Journey Report
Think of your marketing budget as a bucket of water and your channels as different plants you need to grow. Without a customer journey report, you're just splashing water everywhere, hoping some of it actually lands on the roots. You see leads pop up in your CRM, but a frustrating number of them are mysteriously labeled ‘Direct’ traffic, leaving you completely in the dark about what actually worked.
This is a common headache. You pour money into ads and content, but when it’s time to prove what you're getting for it, you're mostly just guessing. A customer journey report cuts through that fog by drawing a clear, visible line from your marketing spend straight to your revenue.
Uncovering the True Source of Your Leads
A good customer journey report works like a detective, tracing a customer's steps all the way back to their very first touchpoint. It finally answers the questions that keep every marketer and business owner up at night:
- Which marketing channels are bringing in actual paying customers? It’s time to look past simple lead volume and see which sources deliver people who actually convert.
- Where should I put my next marketing dollar? You can confidently allocate your budget to the channels that have a proven track record of success.
- Which campaigns are just dead weight and need to be cut? Stop wasting money on activities that only bring in tire-kickers.
- What was the very first interaction that led to a sale? This helps you understand the complete path from initial awareness to the final purchase.
Getting answers to these questions transforms your marketing strategy from one based on gut feelings to one driven by hard data.
A customer journey report isn't just about tracking clicks; it's about connecting marketing actions directly to business outcomes. It’s the ultimate tool for proving marketing’s value and making smarter, data-backed decisions.
From Blurry Data to Sharp Insights
Here’s another way to look at it: without a proper report, analyzing your leads is like trying to read a blurry photo. You can make out the general shapes—you know you're getting leads—but all the important details are fuzzy. You have no idea if that lead came from a specific blog post, a LinkedIn ad, or a referral from a partner's site.
The report brings that picture into sharp focus. It organizes your data, suddenly revealing that the leads from "Organic Search" are turning into high-value customers, while the ones from that recent social media campaign rarely make it past the initial inquiry. This is the kind of insight that lets you take precise, effective action. You can learn more about this by diving into the fundamentals of marketing attribution and how it powers these reports.
Ultimately, building a customer journey report is about one thing: it lets you stop guessing and start knowing. It gives you the evidence you need to justify your marketing spend, fine-tune your strategies, and drive real, sustainable growth for your business.
Gathering the Essential Data for Your Report
A customer journey report is only as good as the data you put into it. Without clean, consistent information, you're flying blind, just guessing where your best leads and customers actually come from. Think of this data like a breadcrumb trail for every single lead—it shows you exactly where their journey started and the path they took to find you.
To really nail down a lead's origin story, you don’t need to track dozens of confusing metrics. It really boils down to just six core pieces of attribution data. When you capture these details for every lead, you have everything you need to build a powerful, actionable report right inside your CRM.
The diagram below shows how a visitor moves from an unknown source to a lead, and finally, to a customer.
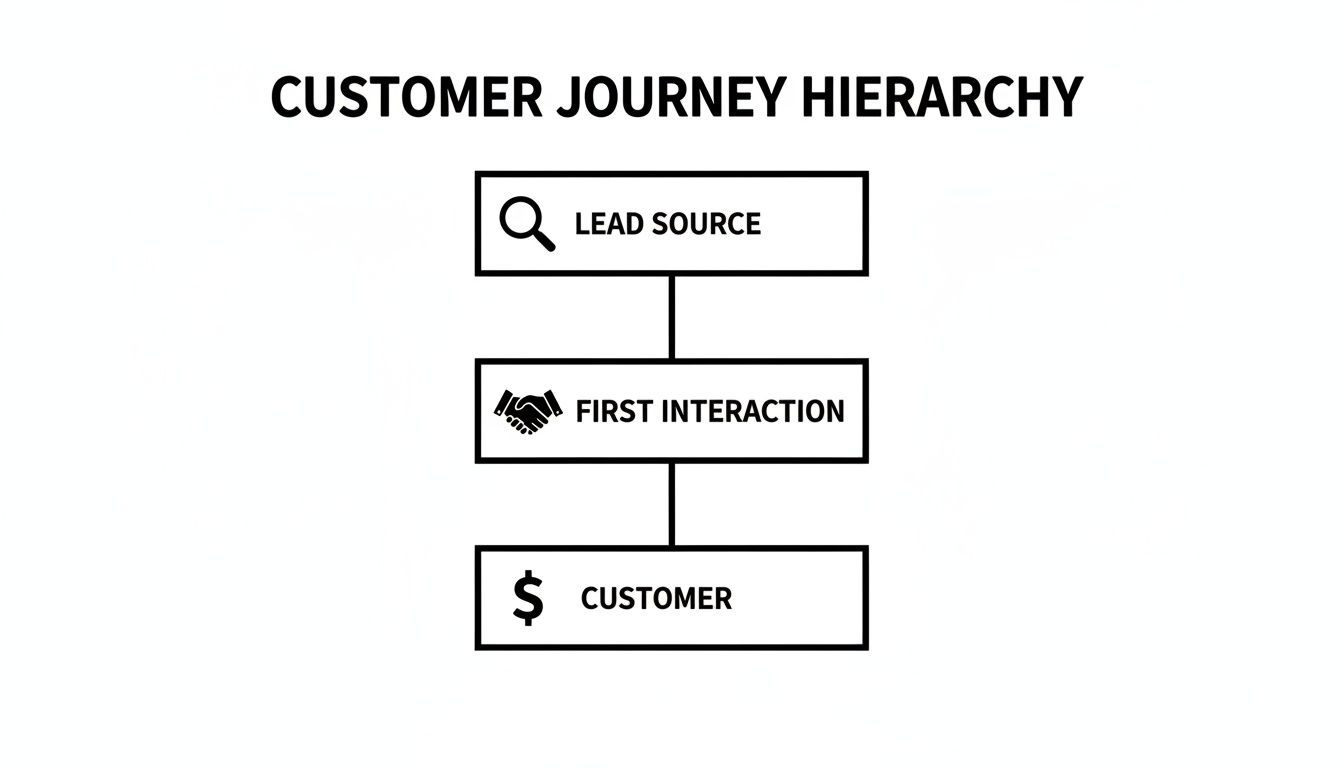
This process highlights why tracking that very first interaction is so critical. It’s the starting point for figuring out which channels bring you not just leads, but valuable, paying customers.
What Data Do You Actually Need?
To get a crystal-clear view of your marketing performance, you need to capture a few key pieces of information when a lead fills out a form on your website. These data points work together to tell a complete story.
Here's a quick rundown of the essential data points you'll want to collect for every lead.
Core Attribution Data for Your Customer Journey Report
| Data Point | What It Tells You | Example |
|---|---|---|
| Channel | The broad category where the lead came from. | Paid Search |
| Channel Drilldown 1 | The specific platform within that channel. | Google |
| Channel Drilldown 2 | The specific campaign that brought them in. | Brand Campaign Q3 |
| Channel Drilldown 3 | The ad group or keyword that triggered the visit. | leadpulse pricing |
| Landing Page | The first page the person visited on your site. | https://getleadpulse.com/pricing |
| Landing Page Group | A category for the type of landing page. | /pricing/ |
By capturing these six fields for every single lead, you're essentially giving your CRM all the ingredients it needs to cook up a detailed and accurate customer journey report.
Breaking Down the 6 Core Data Points
Let's dig into what each of these data points really means. Think of it like a mailing address—you start broad and get more and more specific. To collect this information smoothly, it's a good idea to use effective data collection forms designed for this purpose.
Channel: This is the big-picture view. It’s the highest-level source, like Paid Search, Organic Social, or Referral. It's the "country" on our address label.
Channel Drilldown 1: This gets a bit more specific. If the channel is Paid Search, this would be the platform, like Google or Microsoft Ads. If it's Organic Social, this would tell you if it was LinkedIn or Facebook.
Channel Drilldown 2: Now we're getting granular. For a lead from Google Ads, this field would tell you the exact Campaign Name. You’re starting to connect leads to specific marketing efforts.
Channel Drilldown 3: This is the most detailed level. It often tells you the specific Ad Group or even the Keyword that brought the person to your site.
Putting it all together, you can trace a lead from a broad channel like "Paid Search" all the way down to a specific keyword like "customer journey report software." That's powerful stuff.
Don't Forget the Landing Page
The last two data points are all about where on your site the journey began. This is hugely important for understanding which pages are actually converting visitors into leads.
Landing Page: This is simply the full URL of the very first page a visitor saw on your site. For example,
yourwebsite.com/features/reporting-tools.Landing Page Group: This helps with analysis by grouping similar pages. For instance, all your blog posts could be grouped under "/blog/" and all product pages under "/features/".
The key is to get this information captured automatically every time someone fills out a form. A great way to do this is by using hidden fields in your forms. This technique ensures that every new lead arrives in your CRM with its complete "origin story" already attached.
How to Automate Attribution Data Capture Without Code
Let's be honest. The hardest part of creating a customer journey report isn't building the report—it's getting clean, reliable data into your CRM in the first place. This is where most businesses get stuck. They find that critical UTM parameters are missing from lead records or that the data they do have is a complete mess.
This data gap forces marketers to do manual grunt work, trying to stitch together where leads actually came from. More often than not, it’s just a guessing game. The alternative, wrestling with something like Google Tag Manager, can feel like a nightmare for anyone who isn't a developer. You just want to know what’s working, not write lines of code.
The Problem with Manual Data Entry
Adding a "How did you hear about us?" field to your forms seems like an easy fix, but it's notoriously unreliable. People forget, they guess, or they give you vague answers like "Google" or "online." You’re left with junk data that’s useless for any real analysis.
This creates a massive blind spot in your marketing. How can you confidently decide where to put your budget if you don't have a trustworthy way to connect your marketing spend to actual results? This exact problem is why so many businesses are now turning to automated solutions.
And this isn't just a small trend; it's a huge market shift. The global customer journey analytics market was valued at USD 55,748.53 million in 2022 and is expected to skyrocket to USD 287,650.16 million by 2031. This growth is all about businesses getting serious about making data-driven decisions without getting tangled up in technical headaches. You can dive deeper into this growth by checking out the full customer journey analytics market research.
Introducing a 'Set and Forget' Solution
This is where a tool like LeadPulse (powered by Attributer) changes the game. It’s designed from the ground up to be a simple, "set and forget" solution that works quietly in the background to capture the data you need. Once it's on your website, it automatically captures six key attribution data points for every single visitor.
Here’s a quick rundown of how it works:
- It detects the source: When someone lands on your site, LeadPulse instantly figures out where they came from—whether it was a Google Ad, an organic search, a post on LinkedIn, or a link from another website.
- It stores the data: This attribution info is saved in a cookie in the visitor's browser. This means it remembers their original source even if they click around on multiple pages or leave and come back days later.
- It populates your forms: When that visitor finally fills out a form, LeadPulse automatically writes all that stored data into hidden fields on your form.
This all happens completely behind the scenes. You don't have to lift a finger, and your visitors won't notice a thing.
The whole point is to get complete and trustworthy lead source tracking with a simple, one-time setup. It gets rid of all the manual entry and guesswork that ruins your reports, ensuring your data is clean right from the start.
How It Looks in Practice
Imagine you have hidden fields in your contact form for "Channel," "Campaign," and "Keyword." LeadPulse simply fills them in the moment a lead hits "submit."
The GIF below gives you a clear look at how LeadPulse grabs the attribution data and passes it into those hidden fields.
As you can see, the data is captured and passed through seamlessly without the user ever seeing it. This information is then sent straight to your CRM along with their contact details, giving every new lead a complete origin story.
Why This Method Is a Game Changer
This automated approach is so powerful because it ensures 100% of your leads show up in your CRM with accurate attribution data attached. No more gaps, no more mysteries around "Direct" traffic, and no more relying on fuzzy, self-reported info.
The core benefits are pretty clear:
- Effortless setup: You add a tiny snippet of code to your site once, and that's it. No need to mess with tags or triggers in Google Tag Manager.
- Consistent data: Every lead gets tagged with the same standardized data, which makes your reports clean and incredibly easy to analyze.
- Complete visibility: You can finally see how all your channels are performing, from paid ads and organic search to social media and referrals.
By automating your data capture, you build a rock-solid foundation for your customer journey report. This means you can spend less time fighting with messy data and more time finding insights and making smart decisions that actually grow your business.
Building Your Customer Journey Report Inside Your CRM
Alright, you've done the heavy lifting. Clean, accurate attribution data is now flowing into your CRM. Now for the fun part: turning that raw data into something you can actually use. This is where you get to build reports that finally show you which marketing efforts are pulling their weight and driving real results.
You’re about to transform a bunch of data points into clear, actionable insights that could reshape your entire marketing strategy.
Building a report inside your CRM isn't as daunting as it might seem. Most modern CRMs like HubSpot, Salesforce, or Pipedrive have fantastic reporting tools that let you slice and dice your data however you want. We'll use HubSpot for our examples here, but the core ideas apply to just about any CRM you might be using.
The goal is simple: create visual reports that answer your most pressing questions at a glance. Which channels bring in the most leads? Which campaigns generate the most valuable deals? And the big one—which marketing activities are responsible for the most revenue?
Setting Up Your First Report: Leads By Channel
Let's start with a foundational report: "Leads by Channel." Think of this as your 30,000-foot view. It gives you a broad overview of where your leads are coming from and is the perfect place to begin because it immediately highlights your top-performing channels.
Here’s a rough sketch of how you’d build this in HubSpot:
- Choose your data source: Start with "Contacts," since that’s where your lead information lives.
- Pick a chart type: A vertical bar chart works great here. It makes it super easy to compare how different channels are performing side-by-side.
- Configure your data: Set the X-axis (the horizontal line) to the "Channel" property that LeadPulse is populating. For the Y-axis (the vertical line), just use a simple "Count of contacts."
Save it, add it to your dashboard, and boom—you have a clear, visual breakdown of lead volume by source.
The image below is a perfect example of what this report looks like on a real HubSpot dashboard.
This simple chart tells a story instantly. In this case, it’s clear that "Paid Search" is the dominant channel for generating new leads.
Moving From Leads to Revenue
Knowing where your leads come from is a great start, but the real magic happens when you connect marketing channels directly to revenue. This is how you calculate your true return on investment (ROI). To get there, you need to build reports based on deals or opportunities.
Let’s create a "Deals Created by Channel" report. The steps are pretty much the same as before, but with one critical change:
- Data Source: This time, select "Deals" as your primary source.
- X-Axis: Stick with the "Channel" property, which should now be associated with your deals.
- Y-Axis: Instead of a simple count, you’ll use the "Sum of Deal Amount." This shows you the total pipeline value each channel has generated.
This single report is a game-changer. It shifts the entire conversation from lead quantity to lead quality. You might find that while one channel sends you a flood of leads, another channel delivers just a handful of leads that are worth ten times more to your business.
By linking marketing data directly to sales outcomes, you move beyond vanity metrics. You’re not just tracking clicks and leads; you’re tracking the direct impact of your marketing on the company’s bottom line.
Drilling Down for Deeper Insights
Once your high-level reports are in place, you can start digging. This is where the "Channel Drilldown" data we captured earlier becomes your secret weapon, allowing you to build granular reports that answer very specific questions.
For instance, you could build reports like:
- Revenue by Google Ads Campaign: Filter your report to show only deals from the "Paid Search" channel, then break it down by "Channel Drilldown 2" (Campaign). Suddenly, you can see exactly which specific campaigns are driving the most revenue.
- Leads by Landing Page: Create a report that counts leads and breaks them down by the "Landing Page" property. This is a fantastic way to identify which pages on your site are your best conversion engines.
- Customers by Social Media Platform: Filter for the "Organic Social" channel, then group the data by "Channel Drilldown 1." Now you can compare performance across LinkedIn, Facebook, X (formerly Twitter), and others. You can learn more about creating these reports in our guide to HubSpot integrations.
This is precisely why journey analytics has become so critical. It demystifies the path from first click to final sale, shining a light on channels and campaigns that are often overlooked. It's a fast-growing field—the customer journey analytics market was valued at USD 4.16 billion in 2023 and is projected to hit USD 10.08 billion by 2032. While there are always challenges, modern tools are making it easier than ever for businesses to understand where their best customers truly come from. You can find more insights about the growing journey analytics market here.
By building out these different reports on a single dashboard, you create a comprehensive customer journey report. You’ll have a 360-degree view of your marketing performance, allowing you to confidently answer where your best customers come from and make smart, data-driven decisions to grow your business.
Turning Your Report Data into Smarter Decisions
A customer journey report is so much more than just a pile of charts and graphs. Think of it as your roadmap for growth—but like any map, it’s only useful if you know how to read it. Now that you have clean data flowing straight from your marketing channels into your CRM, you're ready to stop just looking at numbers and start making smart, evidence-backed decisions.
The real magic happens when you start asking tough questions and let the data give you the answers. It’s all about turning those numbers into strategic moves that actually grow your business.
From Insights to Actionable Strategy
The first step is to look for the stories hidden in your data. You’re hunting for patterns, weird outliers, and untapped opportunities. This means you need to compare channels not just by how many leads they bring in, but by how much real revenue they generate.
For example, your report might show that Organic Search is driving a whopping 30-40% of your leads. This is a pretty common discovery for businesses that get their attribution right with tools like LeadPulse or Attributer, since they correctly identify sources that often get mislabeled as ‘Direct’ traffic. Right away, that tells you your SEO efforts are paying off way more than you thought. Maybe you also notice that email touchpoints are on the rise, which points to another key area to invest in. You can learn more about how different channels contribute to the customer journey to see the bigger picture.
Once you spot these trends, it's time to do something about them. The whole point is to shift from just watching the data to actively using it to get better results.
Common Scenarios and How to Respond
Your customer journey report will shine a light on what’s working and what isn’t. The trick is knowing how to react. Let's walk through a few real-world examples of what your report might be telling you.
Here are a few situations you’ll likely run into:
Scenario 1: Lots of Leads, But Few Customers Your report shows ‘Organic Search’ is a lead-generating machine, but almost none of them ever become paying customers.
- Actionable Decision: Time to play detective. Dive into the 'Landing Page' and 'Keyword' data for those leads. You might find out you're ranking for informational keywords that attract researchers, not buyers. The fix? You could create more bottom-of-funnel content or tweak your landing pages to better qualify visitors from the get-go.
Scenario 2: Few Leads, But Lots of Customers A specific channel, like a referral partner or a niche social media group, sends you only a trickle of leads. But a huge percentage of them turn into high-value deals.
- Actionable Decision: You've just struck gold. Double down on it. Pour more resources into that partnership or ramp up your activity on that platform. This channel is clearly speaking directly to your ideal customer.
A customer journey report doesn't just show you what's working; it illuminates why it's working. It empowers you to stop spreading your budget thin and start making focused investments where they'll have the biggest impact.
Confidently Reallocating Your Budget
One of the most powerful things you can do with this report is reallocate your marketing budget—with total confidence. No more guesswork. No more "gut feelings." You now have hard data showing the return on investment for every single channel.
Let's say your report gives you a breakdown like this:
| Channel | Monthly Spend | Revenue Generated | ROI |
|---|---|---|---|
| Paid Search | $5,000 | $25,000 | 5x |
| Paid Social | $5,000 | $7,500 | 1.5x |
| Organic Search | $2,000 (SEO) | $30,000 | 15x |
The data makes the next move obvious. You could confidently shift some of that 'Paid Social' budget over to 'Paid Search,' or better yet, beef up your SEO investment to capitalize on that incredible 15x return.
This is how a simple report goes from being a static document to a dynamic tool that actively drives your business forward.
Common Questions About Customer Journey Reporting
As you start putting these reports together, you'll probably have a few questions. It happens to everyone. Let's tackle some of the most common ones that come up when marketers first start connecting the dots from first touch to final sale.
How Is This Different from Google Analytics?
This is a great question, and one we hear a lot. Think of it this way: Google Analytics is fantastic at telling you what’s happening on your website. It shows you visitor counts, page views, and how anonymous users click around. It’s all about website behavior.
A customer journey report built in your CRM, however, tells you why it matters to the business. It connects all that website activity directly to leads, deals, and actual revenue.
In short, Google Analytics tells you how many people showed up to the party. Your CRM report tells you which of your invitations brought the guests who actually brought a gift—giving you a clear, undeniable view of your marketing ROI.
Can I Build This Report Without Special Tools?
You could try, but I wouldn't recommend it. The go-to manual method is adding a "How did you hear about us?" field to your forms. The problem is, this approach is notoriously unreliable.
People often can't remember their first touchpoint, so they guess. Or they give you vague answers like "Google" or "online," which doesn't help you one bit. You end up with messy, inaccurate data that can lead you to make some really bad decisions.
To build a customer journey report you can actually trust, you need an automated tool. It just takes the human error and guesswork completely out of the picture.
- Accuracy: It captures the real source every time, not what someone thinks the source was.
- Consistency: The data is clean and standardized, making your reports much easier to analyze.
- Completeness: You get attribution data for every single lead, so there are no blind spots.
Relying on manual entry is like building a house on a shaky foundation. Automation gives you the solid, reliable data you need to make decisions that move the needle.
How Often Should I Review My Report?
Consistency is everything. This report isn't a "set it and forget it" document; it's a living tool that should guide your strategy. For most businesses, a monthly review is the perfect cadence.
Checking in once a month is frequent enough to spot new trends, see how your latest campaigns are doing, and make quick adjustments. It keeps you proactive instead of just reacting to what happened last quarter.
That said, if you're in the middle of a high-stakes, short-term campaign—like a product launch or a big sale—you might want to peek at the report weekly. It really just depends on the pace of your marketing.
The main thing is to make it a habit. When you regularly review the data, you’re always operating with a clear understanding of what’s really working to bring in customers.
Ready to stop guessing and start knowing where your best customers come from? LeadPulse automatically captures marketing attribution data and sends it to your CRM, giving you the clean, reliable information you need to build a powerful customer journey report.
A Marketer's Guide to Cookieless Attribution
Struggling with tracking? This guide explains cookieless attribution in simple terms and shows you how to accurately track your marketing ROI without cookies.
Build a Powerful Marketing Campaign Dashboard That Works
Stop guessing. Build a marketing campaign dashboard that reveals which channels truly drive revenue. A practical guide for non-technical marketers.