Unlocking Success: 10 Key Marketing Metrics to Track in 2025
Unlocking Success: 10 Key Marketing Metrics to Track in 2025
Data-Driven Marketing: Measuring What Matters
Want to know which marketing activities are actually working? This listicle dives deep into 10 key marketing metrics that reveal what's driving results and what needs adjustment. Whether you're a small business owner or a seasoned marketer, understanding these metrics is crucial for maximizing your return on investment (ROI) and achieving sustainable growth.
This isn't just a list of definitions. We'll explore each metric in detail, explaining:
- What it is
- Why it matters
- How to track it
We'll cover critical metrics like Customer Acquisition Cost (CAC), Customer Lifetime Value (CLTV/LTV), and Return on Marketing Investment (ROMI), providing actionable insights you can implement immediately. You'll also learn how to track metrics related to brand awareness, social media engagement, email marketing, website traffic, and customer satisfaction (NPS).
This guide is designed for non-technical marketers and small business owners who rely on tools like Webflow, WordPress, Typeform, and various CRMs. We'll focus on practical application, helping you get the most out of your data without needing to become a data scientist. Get ready to unlock the power of data-driven decision making and take your marketing to the next level.
1. Customer Acquisition Cost (CAC)
Customer Acquisition Cost (CAC) is a key marketing metric that measures the average expense of gaining a new customer. It's calculated by dividing the total marketing and sales costs by the number of new customers acquired within a specific timeframe. Understanding your CAC is crucial for assessing the effectiveness of your marketing campaigns and building sustainable growth strategies. It directly impacts profitability and helps you make informed decisions about resource allocation.
Examples of CAC in Action
- SaaS Companies: Businesses like HubSpot meticulously track CAC by marketing channel (e.g., social media, paid ads, email) to optimize spending and maximize returns.
- E-commerce Brands: Online retailers leverage CAC to determine profitable advertising bids and adjust pricing strategies.
- Subscription Services: These businesses closely monitor CAC trends to predict future unit economics and subscriber growth.
Tips for Tracking and Utilizing CAC
- Comprehensive Cost Inclusion: Factor in all associated costs, including advertising spend, salaries, software tools, and overhead expenses.
- Channel-Specific Tracking: Analyze CAC by channel to pinpoint your most efficient acquisition sources and identify areas for improvement.
- Trend Analysis: Monitor CAC trends over time, rather than fixating on single periods, to identify patterns and understand long-term performance.
- Benchmarking: Compare your CAC to your Customer Lifetime Value (LTV), aiming for a healthy 3:1 LTV:CAC ratio as a general benchmark.
The infographic below visualizes key data points related to calculating Customer Acquisition Cost (CAC), including total marketing & sales costs, the number of new customers acquired, and the resulting average cost per acquisition.
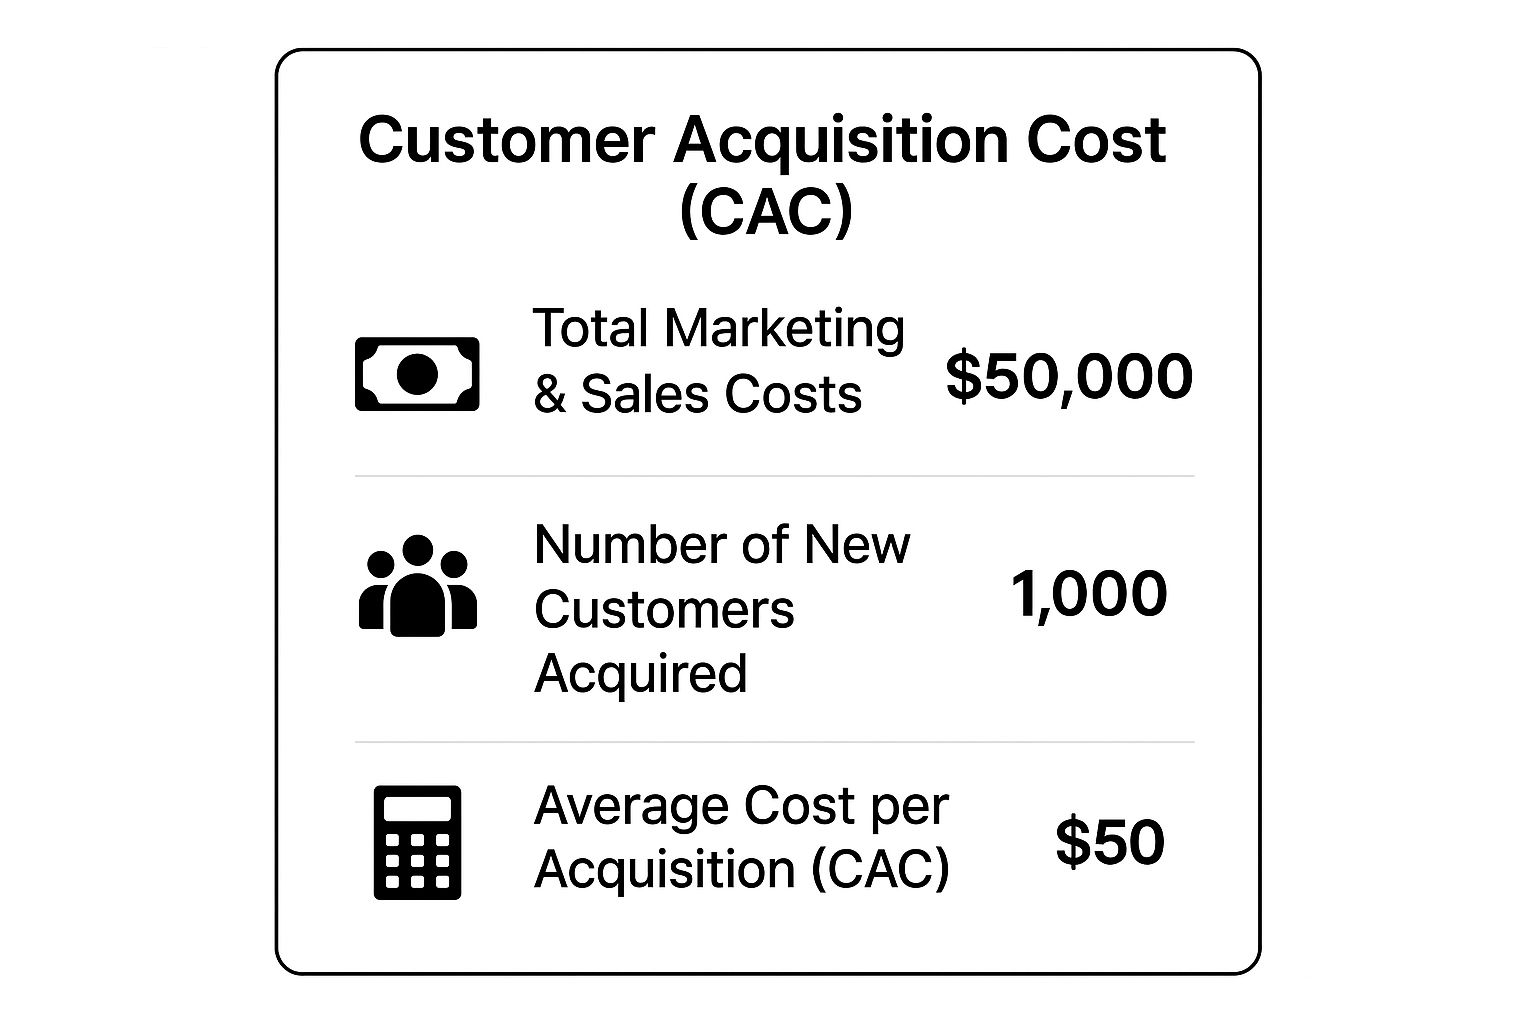
As the infographic demonstrates, understanding the relationship between your total marketing and sales investment and the number of customers acquired is essential for calculating and interpreting your CAC. By monitoring and optimizing this metric, businesses can make data-driven decisions to improve marketing ROI and drive sustainable growth. CAC is particularly valuable for non-technical marketers and small business owners who need to understand where their leads originate and how to allocate their marketing budgets effectively. It helps them answer crucial questions about campaign performance and allows them to fine-tune their strategies for optimal results.
2. Customer Lifetime Value (CLV/LTV)
Customer Lifetime Value (CLV or LTV) represents the total revenue a business can expect from a single customer throughout their entire relationship. This key marketing metric isn't just about past purchases; it's a predictive metric. It helps businesses understand how much they can afford to spend on customer acquisition and retention while maintaining profitability and driving sustainable growth. CLV is essential for strategic decision-making related to marketing spend, pricing, and customer relationship management.

Examples of CLV in Action
- Netflix: This streaming giant uses CLV to determine content investment and pricing strategies, ensuring subscriber retention and maximizing long-term revenue.
- Amazon: Amazon leverages CLV insights for Prime membership optimization, offering targeted benefits and promotions to increase member lifetime value.
- Starbucks: This coffeehouse chain applies CLV analysis to their loyalty program design, rewarding frequent customers and encouraging repeat purchases.
Tips for Tracking and Utilizing CLV
- Multiple Calculation Methods: Use different CLV calculation methods and compare the results to ensure accuracy and a comprehensive understanding of your customer value.
- Customer Segmentation: Segment CLV by customer cohorts (e.g., demographics, acquisition channel) for more granular insights and targeted marketing efforts.
- Regular Updates: Regularly update your CLV calculations as your business model and customer behavior evolve. This ensures your strategies remain aligned with current market dynamics.
- Retention and Upselling: Focus on increasing CLV through proactive retention strategies and targeted upselling/cross-selling initiatives.
CLV is particularly valuable for non-technical marketers and small business owners seeking to optimize their marketing ROI. It provides crucial insights into the long-term value of each customer, empowering businesses to make data-driven decisions about resource allocation and customer relationship management. By understanding and actively managing CLV, businesses can build stronger customer relationships and drive sustainable profitability.
3. Return on Marketing Investment (ROMI)
Return on Marketing Investment (ROMI) measures the revenue generated from marketing activities relative to the cost of those activities. It provides a direct link between marketing spend and business results, enabling marketers to demonstrate the value of their efforts and optimize resource allocation for maximum impact. Understanding ROMI is crucial for making data-driven decisions and ensuring that marketing campaigns contribute to the bottom line. For non-technical marketers and small business owners, ROMI offers valuable insights into the effectiveness of their strategies.
Examples of ROMI in Action
- Procter & Gamble (P&G): P&G utilizes sophisticated ROMI models to optimize its media mix across various brands, ensuring efficient budget allocation and maximizing returns.
- Coca-Cola: This beverage giant measures ROMI across both digital and traditional marketing channels to gain a holistic view of campaign performance and identify areas for improvement.
- B2B Companies: Many B2B organizations track ROMI from activities like trade shows and content marketing to assess the effectiveness of these initiatives and justify continued investment.
Tips for Tracking and Utilizing ROMI
- Consistent Methodology: Establish a consistent methodology for calculating ROMI across all campaigns to ensure accurate comparisons and meaningful insights. Learn more about Return on Marketing Investment (ROMI) at this helpful resource.
- Attribution Modeling: Use attribution modeling to gain a better understanding of the customer journey and how different marketing touchpoints contribute to conversions. This helps allocate budget effectively.
- Long-Term Vision: Consider both short-term and long-term revenue effects when evaluating ROMI, as some marketing activities may have a delayed impact on sales.
- Benchmarking: Benchmark your ROMI against industry standards and internal targets to assess your performance and identify areas for potential growth. This allows for data-driven strategy adjustments.
ROMI empowers marketers to demonstrate the value of their work and make informed decisions about resource allocation. By tracking and analyzing this key marketing metric, businesses can optimize their campaigns, improve their marketing ROI, and drive sustainable growth. For small business owners, this data-driven approach is essential for ensuring that every marketing dollar contributes to the overall success of the business.
4. Conversion Rate
Conversion Rate is a key marketing metric that measures the percentage of users who complete a desired action. This action could be anything from making a purchase to signing up for a newsletter. Calculated by dividing the number of conversions by the total number of visitors, it provides crucial insights into campaign effectiveness and user experience. Understanding your conversion rate is essential for optimizing marketing efforts and maximizing ROI.
Examples of Conversion Rate in Action
- E-commerce Platforms: Sites like Amazon meticulously track product page conversion rates to optimize product listings, pricing, and promotions.
- Travel Bookings: Companies like Airbnb monitor conversion rates from initial search to booking, analyzing differences across device types to improve user experience.
- Inbound Marketing: Businesses like HubSpot measure conversion rates at each stage of their marketing funnel, from lead generation to customer acquisition.
Tips for Tracking and Utilizing Conversion Rate
- Goal Definition: Define clear, specific conversion goals aligned with your overall business objectives. What actions do you want users to take?
- A/B Testing: Test different elements on your website or landing pages using A/B testing. Experiment with headlines, calls to action, and page layouts.
- Segmented Analysis: Analyze conversion rates by traffic source (e.g., organic search, paid advertising) and user segment (e.g., demographics, behavior). This helps pinpoint areas for improvement.
- Quality Over Quantity: Focus on improving conversion rate alongside traffic quality. Attracting more relevant visitors often leads to higher conversion rates.
Conversion rate is a particularly valuable key marketing metric for non-technical marketers and small business owners. It helps them understand how well their website and marketing efforts are performing in terms of turning visitors into leads or customers. By tracking and optimizing conversion rates, businesses can improve their marketing ROI and achieve sustainable growth. It allows them to identify what's working, what's not, and make data-driven decisions to improve their results.
5. Marketing Qualified Leads (MQLs)
Marketing Qualified Leads (MQLs) represent prospects who have shown interest in a company's offerings and fit specific criteria, suggesting a higher chance of becoming customers. MQLs are a critical bridge between marketing and sales, identifying prospects ready for direct sales engagement. They are a key marketing metric because they indicate the effectiveness of marketing efforts in generating sales-ready leads. Tracking MQLs helps businesses optimize their marketing strategies and improve lead nurturing processes.
Examples of MQLs in Action
- Salesforce: Defines MQLs based on engagement with specific content, like downloading white papers or attending webinars.
- HubSpot: Employs lead scoring combining demographics (job title, industry) and behavioral data (website visits, email opens).
- Marketo: Uses automated lead scoring for B2B companies, triggering sales outreach when leads reach a predefined score.
Tips for Tracking and Utilizing MQLs
- Regular Review: Continuously review and adjust MQL criteria based on sales team feedback and market changes.
- Combined Scoring: Implement lead scoring that combines both demographic and behavioral factors for a more comprehensive view of lead quality. Learn more about Marketing Qualified Leads (MQLs) and how they are generated.
- Conversion Tracking: Track MQL to customer conversion rates to validate the effectiveness of your qualification criteria and identify areas for improvement.
- Clear Agreements: Create clear service level agreements (SLAs) between marketing and sales teams to ensure efficient lead handoff and follow-up.
MQLs are a valuable key marketing metric for non-technical marketers and small business owners. By understanding which marketing activities generate MQLs, these businesses can focus on high-impact strategies. Tracking MQLs allows for better allocation of marketing budgets and more efficient lead nurturing, leading to increased sales conversions.
6. Brand Awareness Metrics
Brand Awareness Metrics measure how familiar target audiences are with a brand. This includes both aided (recognition with prompts) and unaided (recall without prompts) brand recognition. These key marketing metrics track the effectiveness of brand-building efforts and provide valuable insights into market position relative to competitors. Understanding brand awareness is essential for long-term growth and market dominance.
Examples of Brand Awareness in Action
- Nike: Tracks brand awareness globally across different demographics to understand market penetration and identify growth opportunities.
- Coca-Cola: Measures brand recognition in emerging markets to tailor marketing campaigns and product offerings to local preferences.
- Tesla: Monitors brand sentiment and awareness through social media to gauge public perception and address any negative feedback.
Tips for Tracking and Utilizing Brand Awareness Metrics
- Multiple Measurement Methods: Use a combination of surveys, focus groups, and digital metrics like social listening and website traffic to get a comprehensive view of brand awareness.
- Quality of Associations: Don't just track awareness levels, but also the quality of brand associations. Understand what people think and feel about your brand.
- Benchmarking: Compare your brand awareness metrics to competitors and industry standards to identify areas for improvement and competitive advantages.
- Correlation with Outcomes: Analyze how brand awareness correlates with business outcomes like sales and customer loyalty over time to demonstrate the value of brand-building activities. This is crucial for justifying marketing spend and demonstrating ROI.
Brand awareness is a crucial metric for non-technical marketers and small business owners. It provides a clear picture of how well their brand resonates with their target audience and informs strategies for increasing visibility and market share. Tracking brand awareness helps these businesses understand their position in the market and make data-driven decisions to enhance brand perception. This knowledge empowers them to build stronger brands and drive sustainable business growth.
7. Social Media Engagement Rate
Social Media Engagement Rate is a key marketing metric that measures how actively your audience interacts with your content on social media platforms. It tracks actions like likes, comments, shares, and saves, indicating the effectiveness of your social media strategy. Understanding your engagement rate is crucial for assessing content quality, audience relevance, and overall brand performance on social media. It helps you refine your content strategy and improve your reach.
Examples of Engagement Rate in Action
- Wendy's: Known for its witty and conversational approach, Wendy's achieves high engagement by directly interacting with its audience and leveraging trending topics.
- National Geographic: This brand maintains strong engagement through stunning visuals and compelling storytelling, captivating their audience with high-quality content.
- Glossier: Glossier built its brand on authentic customer engagement, leveraging user-generated content and fostering a strong community on Instagram.
Tips for Tracking and Utilizing Engagement Rate
- Focus on Meaningful Engagement: Don't just chase vanity metrics like likes. Prioritize comments, shares, and saves, which indicate deeper engagement.
- Benchmarking: Compare your engagement rates to industry averages and competitors on each platform to understand your performance.
- Quality Analysis: Dive into the comments section to understand the sentiment and quality of the conversations happening around your content.
- Content Experimentation: Test different content formats, posting times, and topics to identify what resonates most with your audience and drives higher engagement.
This metric is particularly valuable for non-technical marketers and small business owners who want to understand their audience's preferences and how to create more engaging content. It helps them identify successful content strategies and build stronger relationships with their followers. Social Media Engagement Rate empowers businesses to optimize their social media presence and achieve better results. Tracking engagement rate provides valuable insights into audience behavior and content performance, allowing for data-driven decisions about future social media campaigns.
8. Email Marketing Metrics (Open Rate, Click-Through Rate, Unsubscribe Rate)
Email marketing metrics are key performance indicators (KPIs) that measure the effectiveness of your email campaigns. These key marketing metrics encompass several data points, including open rates (the percentage of recipients who open your emails), click-through rates (the percentage who click on links within your emails), and unsubscribe rates (the percentage who opt out of your email list). Monitoring these metrics provides comprehensive insights into the health of your email program and the level of audience engagement.
Examples of Email Marketing Metrics in Action
- Mailchimp: This platform offers industry benchmark data for email metrics, allowing businesses to compare their performance against competitors.
- BuzzFeed: This media company optimizes subject lines based on open rate performance to maximize audience reach.
- Airbnb: This travel platform personalizes email content based on click-through behavior to enhance user experience and drive conversions.
Tips for Tracking and Utilizing Email Marketing Metrics
- A/B Testing: Conduct A/B tests on subject lines, send times, and content to optimize performance. This helps pinpoint what resonates best with your audience.
- Deliverability Monitoring: Track deliverability metrics like bounce rates alongside engagement metrics. This ensures your emails are reaching inboxes.
- Segmented Analysis: Perform segmented analysis to understand different audience behaviors. Tailor your email content to resonate with specific segments.
- Click-to-Conversion Focus: Focus on click-to-conversion rates (the percentage of clicks that lead to desired actions like purchases). This metric better reflects the business impact of your emails.
Understanding these key marketing metrics helps non-technical marketers and small business owners alike gauge the success of their email efforts. They can use this data to refine strategies, improve engagement, and ultimately drive conversions. By regularly monitoring and analyzing email marketing metrics, businesses can achieve more effective email campaigns and a stronger return on investment.
9. Website Traffic and User Behavior Metrics
Website Traffic and User Behavior Metrics encompass various measurements of how users interact with websites. These include unique visitors, page views, session duration, bounce rate, and pages per session. These key marketing metrics provide valuable insights into website performance, content effectiveness, and the overall quality of user experience. Understanding these metrics is crucial for optimizing your website and improving your marketing ROI.
Examples of Behavior Metrics in Action
- New York Times: The New York Times uses behavior metrics to optimize article placement and website design, ensuring readers find relevant content and stay engaged.
- Shopify: This e-commerce platform analyzes user behavior to improve conversion funnels, helping merchants boost sales and optimize their online stores.
- Netflix: Netflix leverages viewing behavior data to personalize content recommendations, enhancing user satisfaction and driving subscriber retention.
Tips for Tracking and Utilizing Behavior Metrics
- Objective Alignment: Focus on metrics that directly align with your specific business objectives, whether it's lead generation, e-commerce sales, or content engagement.
- Cohort Analysis: Use cohort analysis to understand how user behavior changes over time, identifying trends and patterns among different user groups.
- Goal Tracking: Implement goal tracking in your analytics platform to connect behavior metrics to specific conversions, such as form submissions or product purchases.
- Data Accuracy: Regularly audit and clean up your tracking implementation to ensure data accuracy and reliable insights. Learn more about Website Traffic and User Behavior Metrics and optimizing customer journeys through detailed analysis here.
By effectively tracking and analyzing these key marketing metrics, businesses can make data-driven decisions to enhance their website performance, improve user experience, and ultimately achieve their marketing goals. These metrics are particularly valuable for non-technical marketers and small business owners seeking to understand user behavior and optimize their online presence. They help pinpoint areas for improvement and tailor website strategies for optimal results.
10. Net Promoter Score (NPS)
Net Promoter Score (NPS) is a key marketing metric that gauges customer loyalty and satisfaction. It works by asking customers how likely they are to recommend your company to others on a scale of 0-10. This simple question provides powerful insights into customer sentiment and potential for future growth. Understanding your NPS is crucial for identifying areas for improvement and building a stronger customer base.
Examples of NPS in Action
- Apple: Apple consistently achieves high NPS scores within the technology sector, reflecting strong customer loyalty and brand advocacy.
- Southwest Airlines: Southwest Airlines uses NPS to measure and improve the customer experience, addressing issues and enhancing satisfaction.
- Slack: Slack monitors NPS to track user satisfaction and identify expansion opportunities within its user base.
Tips for Tracking and Utilizing NPS
- Follow-Up Questions: Include open-ended questions after the initial NPS question to understand the reasoning behind customer scores. This provides valuable qualitative data.
- Trend Analysis: Track NPS trends over time, rather than focusing on single measurements. This allows you to identify patterns and assess the long-term impact of your efforts.
- Segmentation: Segment NPS by customer type, product, or touchpoint for more actionable insights. This helps pinpoint specific areas for improvement within different customer segments.
- Close the Loop: Follow up with detractors to address their concerns and turn negative experiences into positive ones. This demonstrates a commitment to customer satisfaction and can build stronger relationships.
NPS is particularly valuable for non-technical marketers and small business owners who want to understand customer perception and identify areas for improvement. By tracking and analyzing NPS, businesses can improve customer retention, increase referrals, and drive sustainable growth through enhanced customer loyalty. This metric helps them answer crucial questions about customer satisfaction and allows them to fine-tune their strategies for optimal results. By understanding customer loyalty, businesses can make data-driven decisions to improve their products, services, and overall customer experience.
Key Marketing Metrics Comparison
| Metric | Implementation Complexity 🔄 | Resource Requirements ⚡ | Expected Outcomes 📊 | Ideal Use Cases 💡 | Key Advantages ⭐ |
|---|---|---|---|---|---|
| Customer Acquisition Cost (CAC) | Moderate: requires data from sales & marketing spend | Moderate: data collection across channels | Clear ROI on acquisition spend; budget optimization | Budget allocation; pricing strategy; channel comparison | Precise acquisition cost measurement; ROI insights |
| Customer Lifetime Value (CLV/LTV) | High: predictive model with multiple methods | High: requires historical customer data | Forecasted revenue per customer; guides investment | Retention strategies; customer segmentation; forecasting | Guides sustainable spend; identifies valuable segments |
| Return on Marketing Investment (ROMI) | Moderate-High: needs revenue tracking & attribution | Moderate: requires sales & marketing alignment | Revenue vs cost ratio; marketing efficiency | Campaign evaluation; budget justification | Direct link between spend and revenue; marketing optimization |
| Conversion Rate | Low: simple ratio calculation | Low: basic traffic and event tracking | Immediate performance feedback; optimization cues | Funnel effectiveness; campaign testing | Easy to measure; rapid insights on messaging effectiveness |
| Marketing Qualified Leads (MQLs) | Moderate: requires scoring system & alignment | Moderate: marketing automation tools | Improved sales targeting; pipeline quality | Lead management; sales & marketing alignment | Focuses sales efforts; enhances lead nurturing |
| Brand Awareness Metrics | High: requires surveys & broad data sources | High: market research & monitoring tools | Brand recognition trends; competitor benchmarking | Brand building; competitive analysis | Indicates long-term brand health; competitive insights |
| Social Media Engagement Rate | Low-Moderate: automated but platform-specific | Low: social media analytics tools | Content resonance; audience interaction insights | Content strategy; social media performance evaluation | Immediate feedback; measures content relevance |
| Email Marketing Metrics | Low: tracked via email platforms | Low: email marketing software | Audience engagement; campaign effectiveness | Email campaigns; segmentation & personalization | Detailed audience insights; supports ROI measurement |
| Website Traffic & User Behavior | Moderate-High: multiple metrics & tools | Moderate: analytics tools (Google Analytics etc.) | User behavior insights; UX optimization | Website performance; content optimization | Comprehensive user insights; free tools available |
| Net Promoter Score (NPS) | Low: simple survey-based | Low-Moderate: survey tools & analysis | Customer loyalty; satisfaction benchmarks | Customer experience tracking; loyalty management | Easy to communicate; directly linked to growth & retention |
From Insights to Action: Leveraging Key Marketing Metrics for Growth
This article explored a range of key marketing metrics, providing a foundation for data-driven decision-making. From understanding the cost of acquiring a customer (CAC) to measuring the lifetime value they bring (CLV/LTV), these metrics offer crucial insights into the effectiveness of your marketing efforts. We've also delved into the importance of tracking Return on Marketing Investment (ROMI), conversion rates, and the qualification of leads (MQLs).
Connecting Metrics to Business Objectives
Remember, these key marketing metrics aren't just numbers. They are tools to understand customer behavior, optimize campaigns, and ultimately drive business growth. By analyzing website traffic, social media engagement, and email marketing performance, you gain a holistic view of your audience and their interactions with your brand. Metrics like Net Promoter Score (NPS) provide valuable feedback on customer satisfaction and loyalty.
Practical Applications for Non-Technical Marketers
For non-technical marketers and small business owners, understanding these key marketing metrics is particularly vital. These metrics help you identify the sources of your leads, optimize your conversion funnels, and demonstrate the value of your marketing activities. Whether you use Webflow, WordPress, or other platforms, integrating these metrics into your workflow is essential for success.
The Future of Marketing Measurement
In today's competitive landscape, leveraging the power of marketing analytics is no longer optional but essential for survival and growth. By consistently monitoring and analyzing key marketing metrics, you can make informed decisions, allocate resources effectively, and achieve a sustainable competitive advantage. Embrace the data, and watch your business flourish.
Taking the Next Step With Enhanced Insights
Ready to take your understanding of key marketing metrics to the next level? LeadPulse helps you connect marketing data to revenue outcomes, providing deeper insights into lead attribution, customer journeys, and marketing ROI. Discover how LeadPulse can empower you to optimize your strategies and drive measurable results. Visit LeadPulse today to learn more.
7 Incredible SEO Dashboard Examples to Track Lead Attribution in 2025
Explore 7 powerful seo dashboard examples to master lead attribution. See templates from Looker Studio, Databox & more to track what truly drives revenue.
How to Measure Marketing ROI: Simple Strategies That Work
Master how to measure marketing ROI with proven strategies that drive results. Get actionable insights from experts who've transformed campaigns.